
Programs for bandwidth monitoring
|
All in One
In a crunch, there's no avoiding Atop. Along with CPU, memory, and hard drive space use, it indicates the load intensity of each interface as a percentage. It provides a wealth of information about the system as a whole, compared to the rather sparse NetHogs.
Atop requires an additional kernel mode that is not part of the standard kernel's scope. Whereas older versions provided no way of patching and compiling a kernel, version 2 with Netatop [13] allows you to add the feature through a module. Details are in the "Creating and Integrating Atop and Netatop Yourself" box.
Creating and Integrating Atop and Netatop Yourself
Many distributions don't yet provide the new Atop version, so you need to build Atop and Netatop yourself from sources. Start by downloading the current archive with the source code, along with the module, from the Atop website to a directory. As of this writing atop-2.0.2.tar.gz and netatop-0.3.tar.gz are the current versions.
Atop currently uses the Zlib and Ncurses libraries, which you can find for Ubuntu-based dsitrbutions in the zlib1g-dev and libncurses5-dev packages.
After unpacking the Atop source code, compile the program with cmake in the unpacked directory. Only the last step – installing the compiled program with make install – requires root privileges. Unpack the sources for Netatop in the same way. For compilation, you need the header files for the current kernel from the linux-headers-<version> package. You can find the current version number with uname -r .
Compile the Netatop source code with make and install the module with make install as root user. As the final step, load the module with modprobe netatop , after which the function is available in Atop. If at some point, you no longer need Netatop, you can uninstall it from the kernel using modprobe -r netatop .
After a successful installation, start Atop and press N to change to network view. The NET column shows the percentage of network process usage based on the total received and transmitted data.
The columns BANDWI (bandwidth incoming) and BANDWO (bandwidth outgoing) show the relevant data. The assignment to each process shows up in the first and second columns and include the process ID and program name. The remaining columns show the traffic separately for TCP and UDP packages.
The TCPSND and TCPRCV fields show the number of sent and received TCP packages; TCPRASZ and TCPSASZ show their average sizes. The UDP fields follow the same pattern.
In Figure 2, the PlaneShift client, Newsreader aggregator, and an apt-get update share the interfaces. The psclient.bin PlaneShift client uses small UDP packages, Newsreader gets to the Privoxy private sphere proxy via the HTTP KIO module, and the http threads belong to Apt-get.
 Figure 2: Atop shows how much bandwidth the PlaneShift client, the Newsreader aggregator when updating feeds, and apt-get update need.
By default, Atop shows all interfaces bearing traffic and all processes that create it. With S, you can filter by disk, logical drive, and interface; with P, you can filter by process. Atop uses regular expressions for this. Figure 2 shows, for example, that Atop is hiding disks and logical drives.
Time-Based Overview
To get totals of traffic usage or for your own dedicated servers that charge rates for volume of traffic used, you can use programs that display data transfer per day, week, or month, and you can estimate the expected data volume for a time interval.
Atop provides reports for an interval, but it doesn't summarize the data for interfaces. One tool that does is the command-line program vnStat. Technically speaking, vnStat runs with normal user privileges, but it's become customary to write compact binary data to /var/lib/vnstat/<interface> over the vnstatd service that runs with root privileges.
Use the command vnstat -u -i <interface> for each interface to monitor, which accesses a separate database. A service vnstat start starts the recording service. Starting the program without parameters, you get an overview like what you see in Listing 2.
Listing 2
Overview with vnStat
# vnstat
                   rx      /      tx      /     total    /   estimated
 eth0:
     Dec '13     3.75 GiB  /  298.87 MiB  /    4.04 GiB  /    7.67 GiB
   yesterday   110.05 MiB  /   12.09 MiB  /  122.14 MiB
       today   134.50 MiB  /    6.67 MiB  /  141.17 MiB  /     188 MiB
 wlan0:
     Dec '13    11.35 MiB  /    1.42 MiB  /   12.77 MiB  /   21.00 MiB
   yesterday        0 KiB  /       0 KiB  /       0 KiB
       today        0 KiB  /       0 KiB  /       0 KiB  /      --
The tool logs the data and displays it in columns for each defined interface. Whereas the first column shows the timeframe, the next two show the amount of received and transmitted data, with the fourth column showing the total number. The last column shows the expected data traffic for the given month.
With regard to mobile access, you're advised to check with your provider regularly so that differences in counting methods are caught in time. A little buffer up to the maximum limit doesn't hurt to stay on the safe side.
By default, vnStat shows the data for the past two days and a summary of the month. Use the -i <interface> option to restrict the output to the given interface. The -w option provides a weekly overview; with -h you get an hourly report that includes an ASCII graph (Figure 3). An interface at more than 90 percent capacity is highlighted in red.
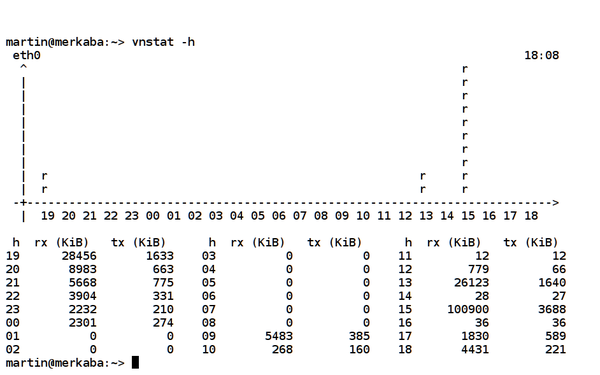 Figure 3: An hourly report from vnStat with a peak data reception between 15:00 and 16:00.
« Previous 1 2 3 4 Next »
Buy this article as PDF
Pages: 6
(incl. VAT)
Buy Ubuntu User
US / Canada
UK / Australia
Related content
-
Analyzing network traffic with iftop

Sluggish network connections can be nerve-wracking. Checking live statistics about network traffic can help pinpoint the problem. Iftop is a command-line system monitoring tool that can help you identify bandwidth hogs and keep traffic moving.
-
Understanding and using the Tor network

Given the extent to which intelligence agencies have been tapping data off the Internet, those wanting to protect their privacy need to take action. Tor can help you.
-
Surfing the Internet anonymously with JonDonym

JonDonym lets you surf the Internet anonymously without complicated configurations, even from a live stream.
-
Easy backups with Obnam

The Obnam command-line tool allows backups and restores, even when the X server is on strike. Its many options will easily meet the needs of a SOHO environment.
-
Zeroshell workshop

A wireless LAN is easier to set up than a cable LAN but is significantly less secure. A RADIUS server can change that.