
Blueprint
Using LaTeX and the TikZ package, you can create high-quality vector graphics to improve your documents by making them more visually appealing.
|

Lusi, freeimages.com
Using LaTeX and the TikZ package, you can create high-quality vector graphics to improve your documents by making them more visually appealing.
LaTeX is not used just to produce unsightly, gray text boxes. With the right packages, you can add color [1] to your pages and integrate external graphics on demand [2].
The TikZ [3] package lets you create vector graphics from within LaTeX. The package is based on the PGF package and simplifies its use. With TikZ, you can create high-quality illustrations with a few lines of code that you can easily integrate into a LaTeX document. However, you do have the disadvantage of not being able to immediately see what the graphic looks like: Every change requires a LaTeX run. The KTikZ [4] program helps in this regard by showing the graphic right away (Figure 1).
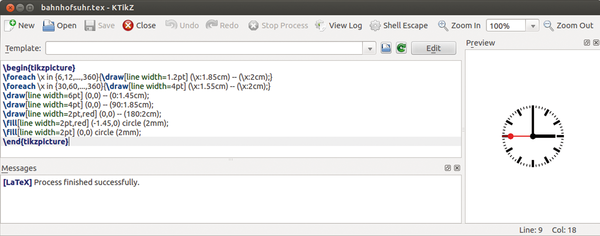 Figure 1: The KTikZ editor lets you see created graphics right away.
Applying TikZ is easy. You download the preamble of the corresponding package using the \usepackage{tikz} command. The commands you use to create graphics are available mainly in tikzpicture (Listing 1, lines 1-3). You can alternatively use the command shown in line 4, which works if you're using only a few commands for the graphics.
Listing 1
Template for Graphic Commands
01 \begin{tikzpicture}[options]
02 commands
03 \end{tikzpicture}
04 \tikz[options]{commands}
Table 1 shows how you can affect the output. These options also apply to single commands, in which case they apply only to the graphic created with that command. Conversely, it's possible to apply the options globally that were used for individual commands. All graphics would then be uniformly affected by them.
Table 1
Options
| Option | Effect |
|---|---|
scale=<factor>
|
Enlarging by the factor, or scaling down by a negative factor. |
rotate=<angle>
|
Rotating by the given angle. |
baseline=<value>
|
The given value is on the baseline instead of being the lowest point in the graphic. |
The command that is used to draw lines and Bézier curves follows the \draw[<options>] <path>; pattern. Options determine the line styles and colors. What you enter as the <path> varies depending on the graphic you're creating.
Listing 2 is an example for lines and Bézier curves. The points with which you can construct graphics are enclosed in parentheses, and the coordinates are separated with commas (line 1). If you omit length values, the compiler interprets them as units in the coordinates system, where a unit is one centimeter.
Listing 2
Lines, Shapes, and Curves
01 \tikz{\draw (0,0) -- (2,2) (0,0) |- (2,2);}
02 \tikz{\draw (0,0) -- (45:2.83cm) (0,0) |- (45:2.83cm);}
03 \tikz{\draw (0,0) -- ++(2,2) ++(-2,-2) |- ++(2,2);}
04 \tikz{\draw (0,0) |- (2,2) -- cycle;}
05 \tikz{\draw (-2,0) .. controls (-1,1) and (1,1) .. (2,0);}
06 \tikz{\draw (0,0) circle (2cm);}
07 \tikz{\draw (0,0) arc (30:60:2cm);}
08 \tikz{\draw (0,0) ellipse (2cm and 1cm);}
09 \tikz{\draw (0,0) rectangle (4,4);}
As an alternative, you can enter polar coordinates separated by a colon (line 2), which changes the meaning: The angle now precedes the colon and is followed by the distance. By default, the center of the coordinate system is the central point relative to which you define all other points. If you enter a double plus sign (++ ) in front of the parentheses, the point you place appears relative to the point just before it (see line 3).
Lines 1 through 4 in the listing create the same graphic in four different ways. The code in line 1, with the – command, draws a straight line between points (0,0) and (2,2) .
The pipe character followed by a hyphen (|- ) ensures that no direct connection occurs between the two points – rather, it consists only of horizontal and vertical lines, with the vertical first and then the horizontal to make the connection. The inverse positioning (-| ) would have the opposite effect.
Both commands together in line 1 create a right triangle (with the right angle in the upper left). Line 2 defines the same triangle with polar coordinates. Starting at point (0,0) is a line 2.83-cm long at an angle of 45 degrees; then, again from point (0,0) , a vertical line extends to the end point of the previously drawn line, and finally a horizontal line extends to this point, forming the right angle of the triangle.
Line 3 creates the same figure again, this time with the points relative to one another. Line 4 accomplishes this by first creating the right angle, then using the – cycle command to cycle lines through each coordinate point and connect the two ends together.
You can also draw curves. Line 5 in Listing 2 does so with the four points. The first parentheses contain the starting point, and the fourth contain the end point. The two control points are between them.
Lines and curves let you create any figure. Line 6 in Listing 2 shows the command creating a circle. The first parentheses enclose the center point, and the second give the radius of the circle.
To draw just an arc, use the command in line 7. The first parentheses are again the center point, and the second parentheses provide the parameters beginning angle, ending angle, and radius.
You draw an ellipse at line 8. You provide similar parameters, in this case the center point and then the length of the major and minor axes. Line 9 creates a rectangle, with the first coordinate the lower left point and the second coordinate the upper right point.
Pages: 6
US / Canada
UK / Australia
Proofreading, wordsmithing, and finalizing the layout are all steps in the final editing phase of a document. LaTeX used with additional software can help you master these steps.

Instead of toiling over a graphics layout, you can use Graphviz to concentrate on the essential content and let the software do the design.

You can edit your LaTeX documents with online editors that run across platforms and are device independent. Documents get saved online, thus giving you and other members of a work group easy access from anywhere.

Using MyPaint and a graphics tablet, you can create or trace drawings with the feel of real pens and brushes. All the necessary tools are included.

Network plans, nested dependencies, or binary trees – with Graphviz, you can visualize complex relationships in a simple way.