
Pyspread – The Spreadsheet with a Python connection
|
Formulas and References to Individual Cells
A three-dimensional reference vector S serves as the basis of all calculations in Pyspread. It consists of the values for each line and column and the number of the data sheet. The comma is used as a separator between the values, and all indexes start counting from zero.
Both absolute and relative references to cells can be made. For relative references, the available variables are X , Y , and Z . They include the current row (X ) and column (Y ), as well as the number of the data sheet (Z ). You can address the cell in the next row of the same data sheet, with the notation S[X+1, Y, Z] .
The travel expense example uses absolute references. For example, to determine the number of kilometers for the first trip, row 1, column 4 has the formula S[1,0,0] * S[1,3,0] . This computes the kilometers for the distance of a single trip with absolute references to a cell. The sum total of all distances is then the sum of several cells in a column. Valid formulas for this include:
- Variant 1: sum([S[r,4,0] for r in range(1,6)])
- Variant 2: sum(S[1:6,4,0])
Variant 1 follows a functional programming approach and runs the sum function against column 4 in combination with a for loop, which iterates against the variable r in a value range from 1 to 6. This reads the contents of the cells in rows 1 to 6. The significantly more compact variant 2 uses the typical Python notation for a range: Rows 1 to 6 are entered as colon-separated numbers in the sum function. The results computed are identical to variant 1 and is often easier for non-programmers to read.
However, sum() is not the only feature from the Python universe that you can use. Table 1 provides a brief overview of the possibilities. You can embed features from other Python modules via an assignment as follows:
Variable = _ _import_ _("Module")After this assignment, the appropriate function from Module is available for all the cells in your data sheet.
Table 1
Pyspread Standard Functions (Selection)
| Function | Result |
|---|---|
| abs() | Absolute value |
| all() | true , if no element of a list is empty |
| any() | true , if at least one element of a list is empty |
| max() | Highest value in a list |
| min() | Lowest value in a list |
| pow() | Power of a value |
| round() | Rounded numeric value |
| sum() | Sum of a list |
Creating & Embedding Charts
Charts visualize the relationships between numbers. Pyspread hides its chart features behind an unassuming button with the two colored curves. To create graphics, Pyspread relies on the Matplotlib function library, as mentioned earlier.
Pressing the button opens a dialog box that lets you design the chart (Figure 2) – on the left are the settings for labels and scales, in the middle are those for chart data (values), and on the right is a preview of the resulting graph. However, this dialog box was designed for very large screens. Although you can enlarge the box and dynamically adjust the column widths to the size of the window, you will still see hardly anything on a smaller screen. This is particularly true of the middle column in which you (would want to) enter the data range for the chart. First, you need to access the fields, and I only managed to do so in testing by massively enlarging the window.
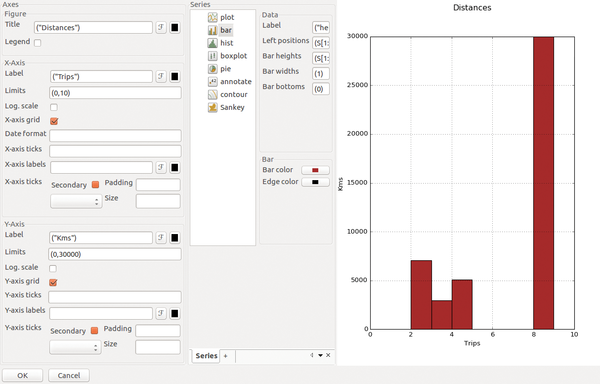 Figure 2: The dialog box for creating graphs.
The conclusion for the Charts function is thus "somewhat inconvenient." I finally achieved some results, but only after some stoic exploration, because the documentation doesn't help here – there is simply no information on this feature, and the contextual help for many input fields is unusable.
Aside from the idiosyncratic column widths, it is hard to tell what to enter in the input fields for the chart – single values or lists – and once you know what to enter, you still need to find out where it belongs. Additionally, the format of the entries is problematic. The range notation mentioned earlier does not work here; what does work is a bunch of individual values with a notation of (<value1>, <value2>) , etc. I managed to reference a single cell using the reference vector S , as in S[1,2,3] for the second row, third column in the fourth data sheet.
« Previous 1 2 3 Next »
Buy this article as PDF
Pages: 4
(incl. VAT)
Buy Ubuntu User
US / Canada
UK / Australia
Related content
-
IPython Notebook lets you do more than just program

The IPython Notebook environment offers much more than just the interactive execution of Python instructions. It can seamlessly integrate documents, programs, and tools with ease.
-
Exploring math with GeoGebra

GeoGebra breathes life into dry numbers. With a few clicks, you can discover @#the beauty of polynomials and functions.
-
Encrypting email with GnuPG

US intelligence agencies tap into billions of call data and electronic messages monthly – reason enough to consider encrypting your email traffic.
-
Working with SQLiteStudio

SQLiteStudio, a compact graphical tool, lets you complete everyday tasks relating to SQLite databases quickly and easily.
-
Programs for bandwidth monitoring

Many programs communicate over the network, and when a bottleneck occurs, these tools can help you determine the cause.