Programs for bandwidth monitoring
No one is happy when the local network goes down. With a few helpful tools, however, you can start searching immediately for the nasty LAN-breaking culprit and fix the situation in an instant with a bit of skill and some know-how. Using a combination of iptraf, ifstat, tcpstat, bmon, and pktstat, you can quickly find what's impeding your data traffic through NetHogs [1] and Atop [2].
Although real-time analysis tools are good for answering questions about the current state of things on the Linux system, they are less suitable for longer-term evaluation. Answers to questions like "How much traffic did clients and network services produce in the last week" or "Who clogged things up last night at 2 o'clock?" require that you keep the data throughput and statistics constantly in sight.
Programs such as vnStat [3], ntop [4], darkstat [5], and BandwidthD [6] can help you in this endeavor as well as in drilling down into the protocols and processes. Some of the tools also provide a web-based interface and are thus ideally suited for installation on routers or servers, allowing for reliable reporting over time intervals.
On the Fly
If you just want to take a quick glance at the console to see which interfaces are experiencing unusually high traffic, then netstat [7], nload [8] and nicstat [9] are viable options. The first two have been standard tools for Linux for years, whereas the third is a newcomer that comes from (Open)Solaris administrators. Ubuntu packages the first two by default, and the third is available from James Troup's PPA [10].
Nicstat shows the values for each interface (Listing 1, second column), along with received and transmitted data volume per second (third and fourth column), average packets per second (fifth and sixth column) and packet size (the last two columns). The last two columns show the degree of use and saturation. Listing 1 clearly shows that most of the data flows over eth0 , with the largest packets coming over the loopback device lo , while the wireless interface wlan0 seems inactive.
Listing 1
Nicstat Displays Data Volume, Packet Size, etc.
merkaba:~> nicstat
    Time      Int   rKB/s   wKB/s   rPk/s   wPk/s    rAvs    wAvs %Util    Sat
19:53:07     eth0    2.39    0.11   11.64    0.88   210.4   127.4  0.02   0.00
19:53:07       lo    0.34    0.34    0.20    0.20  1719.8  1719.8  0.00   0.00
19:53:07    wlan0    0.01    0.00    0.05    0.00   169.7   155.4  0.00   0.00
Under the Hood
Running the NetHogs program requires root privileges. At first, it collects only the information for the eth0 interface, but you can add further options as parameters.
The tool then displays a list of processes based on the network bandwidth (Figure 1). In doing so, it sorts the output in descending order based on usage or load and updates the display every second. With the -d <seconds> option you can set another interval, such as -d 5 for updates every five seconds.
 Figure 1: NetHogs in use – here with SSH, Opera with audio/video plugin, and the Dropbox network service.
The NetHogs output consists of six columns – process ID (PID), process user, program call, network interface used, and data sent and received over it [11]. Pressing M lets you change the output in the last column from KB/sec to the total amount in bytes, KB, or MB.
Pressing R and S lets you sort the output by received or transmitted data, respectively. You can identify the process running amok by the PID and then end or pause the process if needed.
Currently NetHogs analyzes TCP connections only, not UDP services such as BitTorrent. If the text version doesn't suit you, a BusyTasks [12] plugin is ready to integrate with KDE-Plasmoid that uses NetHogs as a back end.
All in One
In a crunch, there's no avoiding Atop. Along with CPU, memory, and hard drive space use, it indicates the load intensity of each interface as a percentage. It provides a wealth of information about the system as a whole, compared to the rather sparse NetHogs.
Atop requires an additional kernel mode that is not part of the standard kernel's scope. Whereas older versions provided no way of patching and compiling a kernel, version 2 with Netatop [13] allows you to add the feature through a module. Details are in the "Creating and Integrating Atop and Netatop Yourself" box.
Creating and Integrating Atop and Netatop Yourself
Many distributions don't yet provide the new Atop version, so you need to build Atop and Netatop yourself from sources. Start by downloading the current archive with the source code, along with the module, from the Atop website to a directory. As of this writing atop-2.0.2.tar.gz and netatop-0.3.tar.gz are the current versions.
Atop currently uses the Zlib and Ncurses libraries, which you can find for Ubuntu-based dsitrbutions in the zlib1g-dev and libncurses5-dev packages.
After unpacking the Atop source code, compile the program with cmake in the unpacked directory. Only the last step – installing the compiled program with make install – requires root privileges. Unpack the sources for Netatop in the same way. For compilation, you need the header files for the current kernel from the linux-headers-<version> package. You can find the current version number with uname -r .
Compile the Netatop source code with make and install the module with make install as root user. As the final step, load the module with modprobe netatop , after which the function is available in Atop. If at some point, you no longer need Netatop, you can uninstall it from the kernel using modprobe -r netatop .
After a successful installation, start Atop and press N to change to network view. The NET column shows the percentage of network process usage based on the total received and transmitted data.
The columns BANDWI (bandwidth incoming) and BANDWO (bandwidth outgoing) show the relevant data. The assignment to each process shows up in the first and second columns and include the process ID and program name. The remaining columns show the traffic separately for TCP and UDP packages.
The TCPSND and TCPRCV fields show the number of sent and received TCP packages; TCPRASZ and TCPSASZ show their average sizes. The UDP fields follow the same pattern.
In Figure 2, the PlaneShift client, Newsreader aggregator, and an apt-get update share the interfaces. The psclient.bin PlaneShift client uses small UDP packages, Newsreader gets to the Privoxy private sphere proxy via the HTTP KIO module, and the http threads belong to Apt-get.
 Figure 2: Atop shows how much bandwidth the PlaneShift client, the Newsreader aggregator when updating feeds, and apt-get update need.
By default, Atop shows all interfaces bearing traffic and all processes that create it. With S, you can filter by disk, logical drive, and interface; with P, you can filter by process. Atop uses regular expressions for this. Figure 2 shows, for example, that Atop is hiding disks and logical drives.
Time-Based Overview
To get totals of traffic usage or for your own dedicated servers that charge rates for volume of traffic used, you can use programs that display data transfer per day, week, or month, and you can estimate the expected data volume for a time interval.
Atop provides reports for an interval, but it doesn't summarize the data for interfaces. One tool that does is the command-line program vnStat. Technically speaking, vnStat runs with normal user privileges, but it's become customary to write compact binary data to /var/lib/vnstat/<interface> over the vnstatd service that runs with root privileges.
Use the command vnstat -u -i <interface> for each interface to monitor, which accesses a separate database. A service vnstat start starts the recording service. Starting the program without parameters, you get an overview like what you see in Listing 2.
Listing 2
Overview with vnStat
# vnstat
                   rx      /      tx      /     total    /   estimated
 eth0:
     Dec '13     3.75 GiB  /  298.87 MiB  /    4.04 GiB  /    7.67 GiB
   yesterday   110.05 MiB  /   12.09 MiB  /  122.14 MiB
       today   134.50 MiB  /    6.67 MiB  /  141.17 MiB  /     188 MiB
 wlan0:
     Dec '13    11.35 MiB  /    1.42 MiB  /   12.77 MiB  /   21.00 MiB
   yesterday        0 KiB  /       0 KiB  /       0 KiB
       today        0 KiB  /       0 KiB  /       0 KiB  /      --
The tool logs the data and displays it in columns for each defined interface. Whereas the first column shows the timeframe, the next two show the amount of received and transmitted data, with the fourth column showing the total number. The last column shows the expected data traffic for the given month.
With regard to mobile access, you're advised to check with your provider regularly so that differences in counting methods are caught in time. A little buffer up to the maximum limit doesn't hurt to stay on the safe side.
By default, vnStat shows the data for the past two days and a summary of the month. Use the -i <interface> option to restrict the output to the given interface. The -w option provides a weekly overview; with -h you get an hourly report that includes an ASCII graph (Figure 3). An interface at more than 90 percent capacity is highlighted in red.
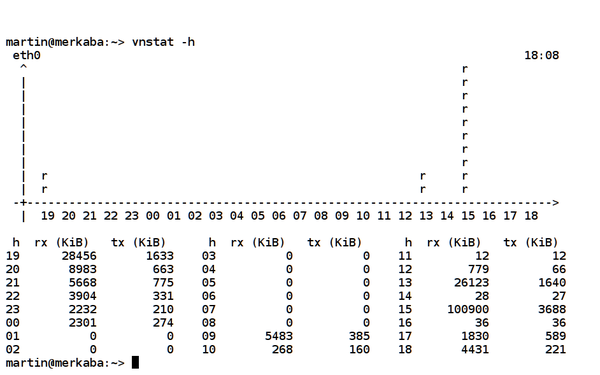 Figure 3: An hourly report from vnStat with a peak data reception between 15:00 and 16:00.
Web-Based Programs
A good selection of web-based programs is available for monitoring complex server environments (e.g., Munin [14], Cacti [15], Zabbix [16], Zenoss [17], Bloonix [18], Nagios [19], and Splunk [20]). However, for single-user systems and special cases, ntop, BandwidthD, and darkstat are viable alternatives.
The ntop service collects data on system activities as a background task. Port 3000 provides access to an interface over which you call up relevant data. Ntop filters the data by IP address, protocol, host/domain, or transfer rate.
Figure 4 shows the statistics as a chart, and Figure 5 shows the throughput for each visiting host. For each computer, you see additional data such as the recognized operating system based on fingerprint detection. In Figure 5, for example, the tool recognized BSD-Unix as the operating system for linux-community.de .
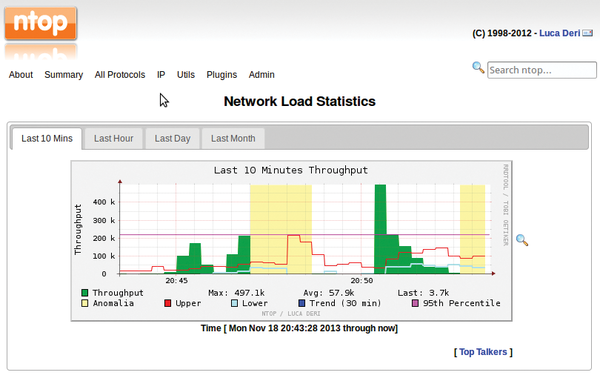 Figure 4: Ntop provides data throughput statistics as a chart.
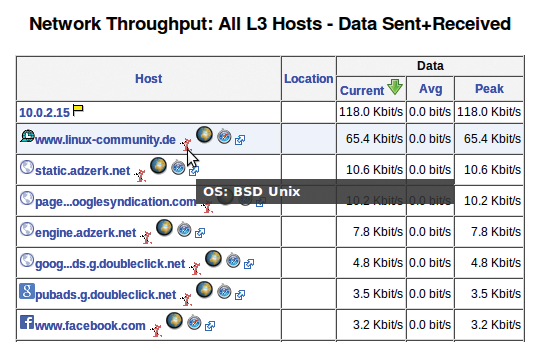 Figure 5: Data throughput per visited host plus additional info.
BandwidthD and darkstat are similar to ntop. To begin, install BandwidthD then tell it what you'd like to observe – that is, the subnets and network interfaces.
Upon restarting the service, the daemon dumps its statistics into /var/lib/bandwitdhd/htdocs/ , unless you specify otherwise. BandwidthD provides charts based on subnets and interfaces based on daily, weekly, monthly, and annual intervals.
Darkstat is small, portable, and lightweight. It listens on port 666 and analyzes data not only over time but also per hosts receiving or transmitting data. Figure 6 shows the analysis over time, which you can get consistently over the web browser. At this point, darkstat doesn't understand IPv6, however.
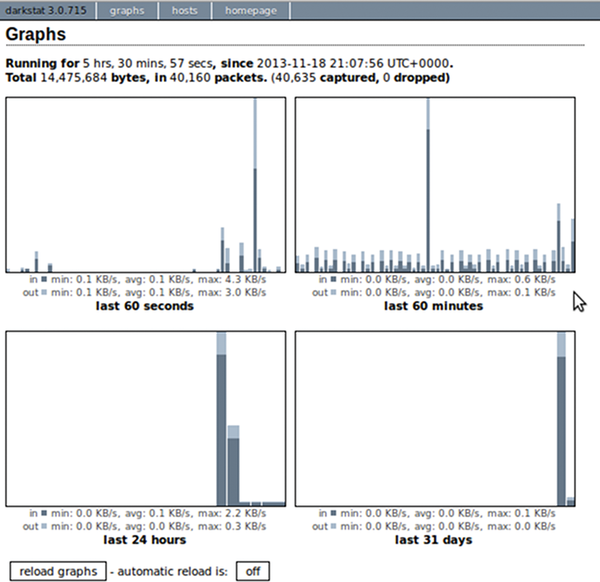 Figure 6: Darkstat shows a bar chart for incoming and outgoing data traffic.
The program starts only after you have successfully configured /etc/darkstat/init.cfg . There you specify the listening interface, the address range of the local network, and the IP address of the listening web interface. Follow up with START_DARKSTAT="yes" .
Safety Measures
With web interfaces, you will want to consider how much to allow outside access. Ntop provides the settings for Debian-based distributions, such as Ubuntu, in the /etc/default/ntop file. Note that it uses the loopback address 127.0.0.1 on port 3000 (GETOPT="-w 127.0.0.1:3000 ) by default.
For Darkstat set the IP address and port via /etc/darkstat/init.cfg . The value BINDIP="-b 127.0.0.1" specifies listening locally only. The BandwidthD program does not come with its own web interface. To access a graphical display, you can install a web server such as Apache or Nginx [21].
Conclusion
You can use the tools described in this article to track programs that are affecting performance, so that no troublemaker remains undetected. Because there's no Swiss Army knife that covers all cases, the web-based programs described in this article can help you complete your toolkit.
Infos
- NetHogs:http://nethogs.sourceforge.net/
- Atop:http://atoptool.nl
- Vnstat:http://humdi.net/vnstat/
- Ntop:http://www.ntop.org
- Darkstat:http://unix4lyfe.org/darkstat/
- BandwidthD:http://bandwidthd.sourceforge.net
- Netstat:http://en.wikipedia.org/wiki/Netstat
- Nload:http://www.roland-riegel.de/nload
- Nicstat:http://sourceforge.net/projects/nicstat/
- Nicstat PPA:https://launchpad.net/~elmo/+archive/nicstat
- NetHogs:http://manpages.ubuntu.com/manpages/jaunty/man8/nethogs.8.html
- BusyTasks:http://kde-apps.org/content/show.php?content=143833
- Netatop:http://www.atoptool.nl/netatop.php
- Munin:http://munin-monitoring.org
- Cacti:http://www.cacti.net
- Zabbix:http://www.zabbix.com
- Zenoss:http://www.zenoss.com
- Bloonix:http://www.bloonix.net (in German)
- Nagios:http://www.nagios.org
- Splunk:http://www.splunk.com
- Nginx:http://www.nginx.org