Surveillance
Linux automatically executes protocols on the activities that take place on the system. This article looks at ways to keep track of users who've logged in.

Devon, Fotolia
Linux automatically executes protocols on the activities that take place on the system. This article looks at ways to keep track of users who've logged in.
Unix/Linux is a multi-user system that was designed to ensure that multiple users can work in parallel. System administrators should always overview their systems and monitor them by regularly running safety checks. The information culled from this activity will allow the sysadmin to find explanations for unusual activity, such as load fluctuations, quickly. If an issue becomes a serious problem, the admin can eliminate the cause to ensure a stable and safe environment for the users.
Previous articles have described programs for bandwidth monitoring, which monitors the network load caused by processes and interfaces. In this article, I'll examine how to monitor users and their activities.
I'll first look at the users who already exist within the system; specifically those who can regularly log in. Generally speaking, these are officially created users with user privileges. At this level, checking for any unauthorized access is quite simple.
Users access the system via the Unix login with a name and certain settings. These names and settings are laid out in the /etc/passwd file (see the "Users in /etc/password" box).
Users in /etc/passwd
01 Debian-exim:x:101:103::/var/spool/exim4:/bin/false
02 haldaemon:x:105:109:Hardware abstraction layer,:/var/run/hald:/bin/false
03 gdm:x:106:111:Gnome Display Manager:/var/lib/gdm:/bin/false
04 avahi:x:107:112:Avahi mDNS daemon,:/var/run/avahi-daemon:/bin/false
05 sshd:x:108:65534::/var/run/sshd:/usr/sbin/nologin
06 saned:x:109:117::/home/saned:/bin/false
Each row describes a user's access privileges based on various fields such as the login name (field 1), the user and/or group ID, his/her password, the user's real name, the user's home directory, and finally, the program that will be automatically run after a successful login (last field). The latter is usually either /bin/sh or /bin/bash used as a login shell.
A list of user accounts can be created by using the all-purpose tool cut . You can use cut to extract each of the first fields of each line of the /etc/passwd file. You cut out individual text fields passing a symbol to use as a separator between the fields and the text field's number in order to separate it from the rest of the data stream.
With the option -d : , the colon acts as the address separator (-d means delimiter ) and -f 1 indicates the first field in each row. Listing 1 displays the results of the call.
Listing 1
Cutting /etc/passwd
$ cut -d : -f 1 /etc/passwd
root
daemon
bin
sys
sync
www-data
test
...
Your list may vary, because it depends both on the users who access the computer and on the programs and services you use. The administrative user root (who has a user ID of 0) always appears first and the www-data user will appear on the list once you have installed a web server, such as Apache, Nginx, or so forth.
All current accounts appear in the list. However, among these, there are also entries for system services that should not have real logins. The usual candidates are exim , sshd , avahi , saned , and also gdm . You can recognize the fact that these "users" have a pretty low user ID.
They also have login shell entries in the form of either /bin/false or /usr/sbin/nologin . If you try to log in as a user on one of these accounts, all you will do is activate the program. If the entry contains /bin/false , for example, you will not get a shell from which you can issue further commands. Instead, you will be sent back to the login prompt.
The awk command in Listing 2 will help you filter out all of the possible users by their user ID from the /etc/passwd file. Note that a regular user ID will always have a value above 1000.
Listing 2
Filtering with awk
$ awk -F: '$3>999{print $3,$1}' /etc/passwd | sort -n
1000 frank
1001 kurs
1002 test
65534 nobody
The -F: option sets the colon as the delimiter, and the '$3>999{print $3,$1}' parameter evaluates the content of the third test field and checks whether it is a value greater than 999. If so, the contents of the third and first field (user ID and login) are output to stdout. The simple quotation marks in the call stops the shell from evaluating the option itself.
The | (pipe) operator directs awk's output to the sort command, which then sorts the individual lines in ascending order. Because the user IDs are in the first column of the output as numerical values, sort uses the -n flag to order the numerical data in the correct way (10 after 9, for example).
You can use this list to check the home directories, for example. Occasionally, users that no longer exist but have not been deleted will be identified. Home directories of users who actually don't have access should also be suspect; especially if the home directory should be located elsewhere according to /etc/passwd .
The list you got from executing Listing 2 will help you, for example, in assessing whether the updated list of users currently logged in to your system is plausible.
The following three standard tools are useful: users , w , and who . The users tool shows a list of user names (Listing 3). If a name is listed more than once, that user, according to the system, currently has many active login sessions. These could be open terminals, for example.
Listing 3
User Names
01 $ users
02 esc nasobem pluteus
Listings 4 and 5 show the outputs of w and who and are considerably more detailed. The w output begins with a header, which contains the running time of the system as well as the system time and uptime.
Listing 4
Output of w
 01:51:50 up 49 days,  7:01,  4 users,  load average: 0.12, 0.27, 0.31
USER            TTY             FROM                            LOGIN@                  IDLE            JCPU            PCPU            WHAT
esc             pts/1   mosh-                   00:27                   1:24m   0.00s   0.00s   tmux att
nasobem pts/16  88.72.218.175-  21:06                   2days   0.12s   20:55   mosh-server new -s -c 256 -l LANG=de_
pluteus pts/50  79.171.206.7            18Aug14 37:10m  0.21s   0.01s                   sshd: pluteus [priv]
Listing 5
Output of who
$ who
esc      pts/1        2014-08-27 00:27 (mosh [2247])
nasobem  pts/16       2014-08-26 21:06 (88.72.218.175 via mosh [10278])
pluteus  pts/50       2014-08-18 09:14 (79.171.206.7)
$
Next to that are the number of users and their average load on the system. Listed underneath are the users and their current system usage. In the second and third columns are the terminals (TTY ) being used and the originating IP address (FROM ).
The mosh- value indicates that an encrypted connection is established with the mosh program [1] [2].
You also see the login time, any idle time, and CPU usage for the past one, five, and 15 minutes. The last column tells you what command the user is running, which can give you a clue as to the kind of activity taking place.
The who command shows the information you can see in Listing 5, which is similar to w , though in a more compact form. You can see the login names, the (pseudo) terminals users are using, the time of login, and finally the IP address the user is connecting from or the program from making the connection. The value in the square brackets indicates the corresponding process number.
The who tool can take the -a option (shows a more verbose output) and the -u option (only shows information for the users that are logged in). In addition to the terminals (tty ), you can also see if the user is accessing the X Window System. Listing 6 shows the output of all activities on a desktop system. Line 2 shows the time the computer was booted. Line 4 shows the change to run level 2 and line 6 shows that an X Window session is running (on display : 0 ).
Listing 6
Output of who -a
01 $ who -a
02                                                      2014-08-26 20:46                        240     id=si term=0 exit=0
03                        Systemstart   2014-08-26 20:46
04                        Runlevel 2            2014-08-26 20:46                                last=S
05                                                      2014-08-26 20:46                        2264    id=l2 term=0 exit=0
06 frank        -         tty7                  2014-08-26 20:46                alt     4444    (:0)
07 LOGIN                  tty1                  2014-08-26 20:46                        4291    id=1
08 LOGIN                  tty5                  2014-08-26 20:46                        4295    id=5
09 LOGIN                  tty4                  2014-08-26 20:46                        4294    id=4
10 LOGIN                  tty6                  2014-08-26 20:46                        4296    id=6
11 LOGIN                  tty2                  2014-08-26 20:46                        4292    id=2
12 LOGIN                  tty3                  2014-08-26 20:46                        4293    id=3
13 frank                + pts/0                 2014-08-26 20:46 15:04  4683    (:0)
14 frank                + pts/1                 2014-08-26 20:46 15:04  4683    (:0)
15 frank                + pts/2                 2014-08-26 20:47 15:03  5022    (:0.0)
16 frank                + pts/3                 2014-08-26 21:11 03:34  5022    (:0.0)
17 frank                + pts/4                 2014-08-26 21:19 00:02  5022    (:0.0)
18 frank                + pts/5                 2014-08-27 00:03 02:04  5022    (:0.0)
19 frank                + pts/6                 2014-08-27 01:15 00:56  5022    (:0.0)
20                        pts/7                 2014-08-27 11:11                        0       id=/7 term=0 exit=0
21                        pts/9                 2014-08-27 11:28                        0       id=/9 term=0 exit=0
22 frank                + pts/10                        2014-08-27 10:49                .       5022    (:0.0)
23                        pts/11                        2014-08-27 11:50                        0       id=/11 term=0 exit=0
Lines 7 to 12 show real terminals (activated by using Ctrl+Alt+F1 to F6) waiting for activity. Lines 13 through 23 contain pseudo terminals, two of which have the error codes 0 (lines 20 and 21). Pseudo terminals appear, for example, when you open a terminal window on an X Window interface in which you activated the program xterm . (See the "Capabilities of Zsh" for additional information.)
Capabilities of Zsh
If instead of using Bash, you use zsh, you can use the built-in command watch to see who logs in and out of your system. Set watch to the value all for all users or notme for all users except for yourself:
rechner% watch=(all)
rechner%
test has logged off pts/7 from localhost.
test has logged on pts/7 from localhost.
rechner%
If you want to see something more exciting than the monochrome output of the tools mentioned above, you can use the whowatch [3] tool. The program shows users and their processes output graphically, in color, and, more importantly, updated in real time.
Figure 1 shows the output of a system with 11 users (7 local, 1 connected via SSH, and 3 others) bustling about. In the illustration, the indented processes were started within outdented processes above them.
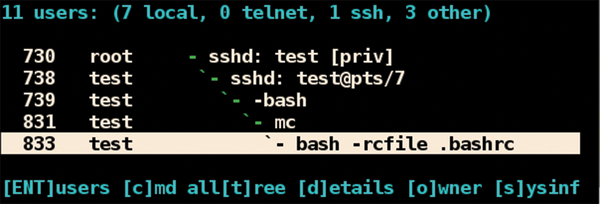 Figure 1: Process analysis with whowatch.
So you can see that the user test connected over SSH activated a terminal, which runs a Bash shell and is currently working with Midnight Commander (mc ). The whowatch command works with the keyboard and has a menu you can start by pressing F9. The menu offers features such as the possibility to display details of a selected processes and to end the process if necessary.
Even more than local activities, connections to and from the outside world are also interesting. The w and whowatch programs mentioned above already gave you some information about activity over the network. An additional tool to use is ss , which is part of the standard set of tools of any Linux. The name of the program comes from socket statistics and, in terms of functionality, it has similarities with netstat [4], as it inspects the network sockets for, TCP, UDP, DCCP, RAW connections, and connections to Unix domain sockets. In addition to the statistical information, it lists the existing connections.
The ss tool offers a variety of options [5]. By using ss -pl | grep 17500 , you will see which processes opened Port 17500. In Listing 7, you can see that would be Dropbox, the file exchange service. Option -p stands for --processes and displays the process names. The -l option stands for --listening and limits the output to only existing listening connections.
Listing 7
Using ss
$ ss -pl | grep 17500
LISTEN  0       128             *:17500         *:*             users:(("dropbox",4957,27))
You can obtain a list of all of the existing TCP connections by using ss -t (Listing 8). The keyword ESTAB is shown when a connection has been established. The CLOSW-WAIT tag is displayed when the socket is about to close. The other columns show the local and remote IP addresses, and the port or the network protocol. The listing shows very common connections such as IMAP, LDAP, IRC, SSH, HTTP, HTTPS, NFS and AFS via IPv4, and IPv6.
Listing 8
Output of ss -t
01 $ ss -t
02 State                        Recv-Q  Send-Q  Local Address:Port                              Peer Address:Port
03 ESTAB                        0               0               2001:bf0:c000:a::1:123:36483            2001:748:100:40::8:112:imap2
04 CLOSE-WAIT   1               0               192.109.42.123:43037                            192.109.42.23:ldap
05 ESTAB                        0               0               192.109.42.123:nfs                              192.109.42.123:685
06 ESTAB                        0               0               127.0.0.1:60479                                 127.0.0.1:13157
07 ESTAB                        0               0               192.109.42.123:59940                            212.201.69.24:ssh
08 ESTAB                        0               0               192.109.42.123:47664                            83.170.73.249:ircd
09 ESTAB                        0               0               192.109.42.123:39582                            62.138.109.50:http
10 ESTAB                        0               0               192.109.42.123:54390                            198.252.206.25:https
11 ESTAB                        0               0               192.109.42.123:955                              192.109.42.119:nfs
12 ESTAB                        0               0               192.109.42.123:34930                            82.96.64.4:afs3-fileserver
You can restrict the output even further if you invoke individual options by employing Boolean operations. The following example filters out all of the existing HTTP connections (Listing 9). You can attain this with option -o state established , or conversely by explicitly stating the network protocol http for the source address and destination address.
Listing 9
Using ss Filters
01 $ ss -o state established '( dport = :http or sport = :http )'
02 Recv-Q       Send-Q          Local Address:Port              Peer Address:Port
03 0                    0                       192.109.42.123:44209            23.21.145.72:http
04 0                    0                       192.109.42.123:41247            80.237.156.34:http
05 0                    0                       192.109.42.123:39582            62.138.109.50:http
06 0                    0                       192.109.42.123:53678            77.67.27.174:http
Use sport for source port and dport for the destination port. Again, you must enclose the string in simple quotation marks, so the shell does not evaluate the expression but rather passes it on to ss as is.
You can also filter HTTPS connections that come from outside using the dst (for destination) keyword and specifying the https protocol (Listing 10).
Listing 10
Filtering External Connections
01 $ ss dst :https
02 State                Recv-Q  Send-Q  Local Address:Port              Peer Address:Port
03 ESTAB                0               0               192.109.42.123:47140            72.21.194.168:https
04 ESTAB                0               0               192.109.42.123:54390            198.252.206.25:https
05 ESTAB                0               0               192.109.42.123:33526            193.149.81.40:https
06 ESTAB                0               0               192.109.42.123:46534            157.56.192.62:https
07 ESTAB                0               0               192.109.42.123:47130            72.21.194.168:https
In addition to the active connections, simple system archeology sheds light on activities from the past. By searching the file /var/log/auth.log , you can figure out which users have logged in and logged out. As the admin user, you can also see the last 10 activities using sshd . In Listing 11, you can see who logged in, who logged out, and any errors.
Listing 11
Examining auth.log
# grep sshd /var/log/auth.log | tail
Aug 26 14:42:36 efho-mobil sshd[31609]: pam_unix(sshd:session): session closed for user test
Aug 26 14:43:13 efho-mobil sshd[31087]: pam_unix(sshd:session): session closed for user test
Aug 26 14:47:38 efho-mobil sshd[31091]: pam_unix(sshd:session): session closed for user test
Aug 26 20:46:21 efho-mobil sshd[4165]: Server listening on 0.0.0.0 port 22.
Aug 26 20:46:21 efho-mobil sshd[4165]: Server listening on :: port 22.
Aug 26 20:46:31 efho-mobil sshd[4165]: Received signal 15; terminating.
Aug 26 20:46:31 efho-mobil sshd[4531]: Server listening on 0.0.0.0 port 22.
Aug 26 20:46:31 efho-mobil sshd[4531]: Server listening on :: port 22.
Aug 27 14:07:53 efho-mobil sshd[730]: Accepted password for test from ::1 port 40402 ssh2
Aug 27 14:07:53 efho-mobil sshd[730]: pam_unix(sshd:session): session opened for user test by (uid=0)
The last tool (installed by default on Ubuntu) provides an overview of the last user sessions. It parses the /etc/log/wtmp file and provides all the activities associated with the login and logout time in reverse order (i.e., the most recent events appear at the top). Listing 12 shows an excerpt from the logged activities where the login, the terminal, the computer of origin, and the time of use are displayed. Currently logged-in users can be identified by the words still logged in in the last column.
Listing 12
Excerpt of Logged Activities
# last
frank   pts/9           :0.0                            Wed Aug 27 14:09                still logged in
test            pts/7           localhost               Wed Aug 27 14:07                still logged in
frank   pts/1           :0                              Tue Aug 26 20:46                still logged in
frank   tty7                    :0                              Tue Aug 26 20:46                still logged in
reboot  system boot     3.2.0-4-686-pae Tue Aug 26 20:46        -       16:18   (19:32)
test            pts/17          192.168.102.21  Tue Aug 26 14:32        -       14:47   (00:14)
The lastlog command (included by default on Ubuntu) shows you which authorized users have logged in. It scans the /etc/log/lastlog file and sorts the output with the user data in /etc/passwd . Listing 13 shows the login names, the terminal, the source IP address, and the last time the user logged in.
Listing 13
Output from lastlog
01 # Username   Port                    from                            last
02 root                 tty5                                                    Tu Jun 10 16:34:26 +0200 2014
03 www-data                                                                     **Never yet logged in**
04 frank                        pts/10          localhost               Mo Aug 25 16:31:09 +0200 2014
05 kurs                 pts/3           172.31.150.110  Di Sep 14 14:09:25 +0200 2010
06 #
The tools presented here can give you a clear overview of which users have been on or not been on the systems you manage. You can also obtain insight into the current state of the system and look back at who accessed the system in the past.
Further information about the users can be obtained by using the finger , cfinger , or pinky tools. Gnome enthusiasts can find information in the gnome-nettool program, which uses a nice graphical interface.
Acknowledgements
The author thanks Wolfram Eifler and Axel Beckert for their input and comments for this article.
Infos